Nowadays, Data is king. If you’re interested in increasing efficiency and productivity, or growing your company to the next level, you’ll need to know the ins and outs of your business’ data. This is easily achievable using Power BI’s suite of business analytics tools to analyse live data and share insights in real-time.
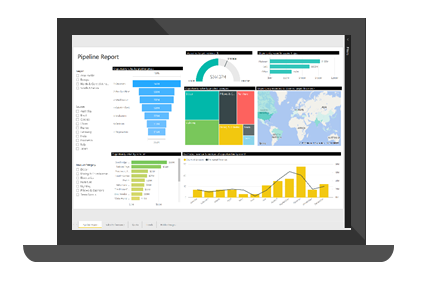
With Microsoft’s Power BI, you’re able to collate data from various sources including Sage, Cim50, SQL, Act!, and more. We can pull these datasets into Reports and Dashboards, showing your key information at a glance as graphical visualisations, making data analysis a breeze. Being able to see key statistics and information like this provides you with an immediate improvement to efficiency, cost-savings, and output levels.
In this brief tour, we’ll show you just what we can do with your data. You can see various examples of how your data can be visualised, interpreted, and interacted with. If you have any questions, feel free to give us a call and let us know what you’re looking for.
Want to talk to someone?
Give us a call on 01268 975007
We are open weekdays 9am – 5:30pm (Fridays until 5pm)
Can’t wait ’til then? Leave your details here and someone will be in touch as soon as we can.